What Are Social Media Metrics?
What's the most important thing to remember about social media metrics?
💡 Tip: Think carefully before selecting your answer!
Create content, post everywhere
Create captions, images, and videos with AI. Schedule to 9 platforms in seconds.
Start your free trial
Social media metrics = The numbers that tell you if your posts are actually working!
Likes, comments, clicks, sales - but which ones actually matter? 🤔
It's like a report card for your social media. Some grades matter for your future, others just look nice! 📊
Why These Numbers Are Super Important
Prove You're Making Money
Show your boss that social media isn't just fun - it's bringing in real customers and sales!
Find What Works
See which posts get the most engagement so you can make more content people actually love.
Stop Wasting Time
Spend your time on platforms and content that actually bring results, not just busy work.
Beat Your Competition
See how you stack up against others in your industry and find ways to do better.
Good Numbers vs. Fake Good Numbers
✅ Numbers That Actually Matter
| Metric | What It Means | Good Rate | Why It Matters |
|---|---|---|---|
| Engagement Rate | % who interact with posts | Instagram: 3%+ | Shows real interest |
| [Impressions](/social-media-terms/twitter-impressions) | Times your content appears | 20-40% of followers | Visibility reach |
| Click Rate | % who click your links | 1-2% is great | Traffic to your website |
| Conversion Rate | % who buy/sign up | 2-3% from social | Actual customers! |
| Cost Per Customer | What each customer costs | Less than they spend | Profitability check |
❌ Vanity Numbers (Look Good But Don't Help Business)
- Follower count (10,000 fake followers vs. 100 real customers?)
- Total likes (without knowing if they actually care)
- Video views (did they watch 1 second or the whole thing?)
- Impressions (just because they saw it doesn't mean they cared)
Remember: Big numbers that don't make you money = vanity! 🪞
How to track social media metrics effectively
Set up proper tracking
UTM parameters: Add tracking codes to all social media links to measure traffic sources accurately.
Conversion pixels: Install Facebook Pixel, LinkedIn Insight Tag, and Google Analytics to track user behavior after clicks.
Goal setting: Define 3-5 key metrics that align with your business objectives rather than tracking everything.
Platform-specific tracking
LinkedIn: Company Page Analytics shows follower demographics and content performance.
TikTok: TikTok Analytics provides video views, profile views, and audience insights - Understand your audience with our TikTok age demographics guide.
Facebook: Meta Business Suite offers complete metrics across Facebook and Instagram.
For comprehensive tracking across all platforms, compare options in our social media tracking software guide. To monitor brand mentions, see our social media listening tools comparison.
What to Track Based on Your Goals
| Your Goal | Track This | Good Number | Action Plan |
|---|---|---|---|
| Get Known | Reach + Brand Mentions | Growing each month | Create shareable content |
| Build Community | Engagement Rate + Comments | 5%+ engagement | Ask questions, reply fast |
| Drive Traffic | Click Rate + Website Visits | 1%+ clicks | Strong calls-to-action |
| Make Sales | Conversions + Revenue | 2%+ convert | Track from click to sale |
Follower growth rate: Month-over-month audience growth
Goal: Lead Generation
Click-through rate: Traffic driven to your website Lead conversion rate: Percentage of social visitors who become leads Cost per lead: Advertising spend divided by leads generated
Goal: Sales
Social commerce conversion rate: Purchases from social platforms Revenue attribution: Sales directly traceable to social media (track with our Customer Lifetime Value Calculator) Customer acquisition cost: Total cost to acquire customers via social
How often should you review metrics?
Daily monitoring
- Engagement on recent posts
- Comments requiring responses
- Ad performance if running campaigns
Weekly analysis
- Top-performing content types
- Engagement rate trends
- Follower growth patterns
Monthly reporting, ROI calculations, Goal achievement assessment, Strategy adjustments based on data
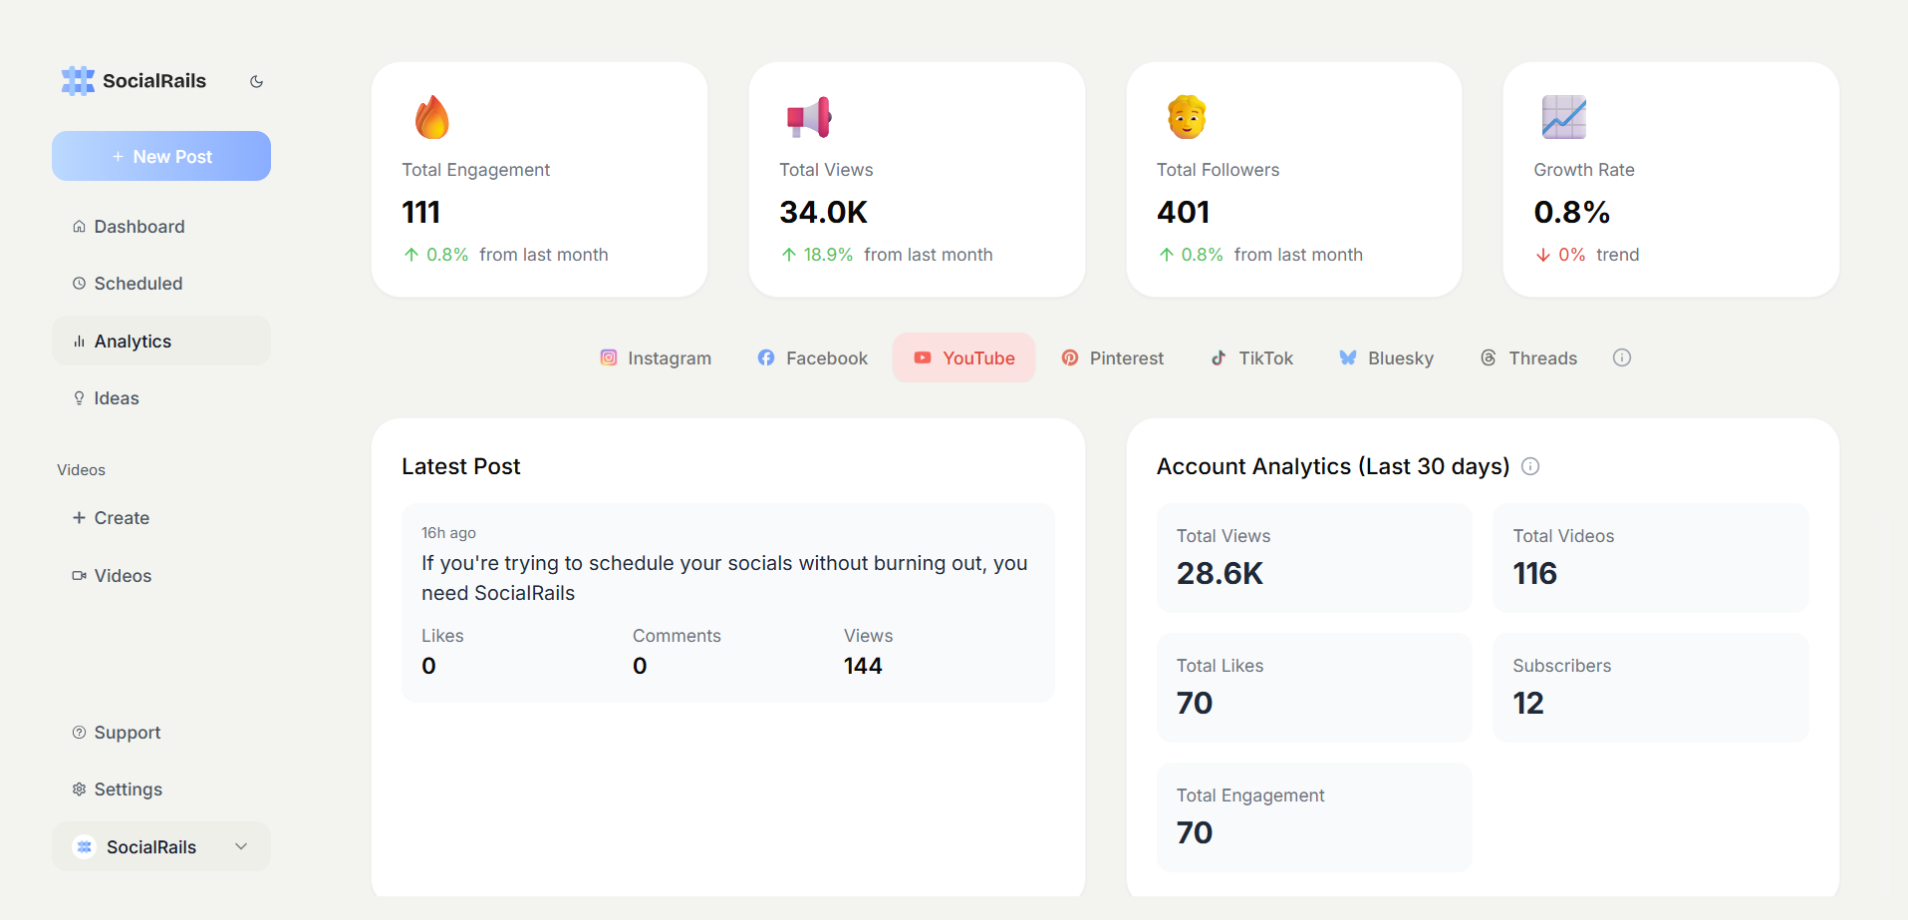
Social media metrics with SocialRails
SocialRails automatically tracks key metrics across all 9 supported platforms in one dashboard. You can quickly identify your best-performing content, optimal posting times, and engagement patterns without switching between multiple analytics tools.
The platform focuses on actionable metrics rather than vanity numbers, helping you understand what content drives real business results.
Common metrics mistakes to avoid
Social Media Metrics: Mistakes vs Smart Tracking
| Category | Rate | Description |
|---|---|---|
Which is the most dangerous metric mistake for businesses to make?
💡 Tip: Think carefully before selecting your answer!
Tracking too many metrics: Focus on 5-7 key metrics that align with your goals rather than monitoring everything.
Comparing apples to oranges: Instagram engagement rates differ from LinkedIn rates. Use platform-specific benchmarks.
Ignoring context: A 50% drop in reach might be due to algorithm changes, not poor content performance.
Short-term thinking: Social media success builds over time. Look for trends over 3-6 months rather than daily fluctuations.