
Social Media Platform Comparison 2026: Which is Best for Your Business? (Data)

Social Media Platform Comparison: Choose the Right Channels for Your Business in 2026
The Social Media Platform Landscape Overview

Create content, post everywhere
Create captions, images, and videos with AI. Schedule to 9 platforms in seconds.
Start your free trial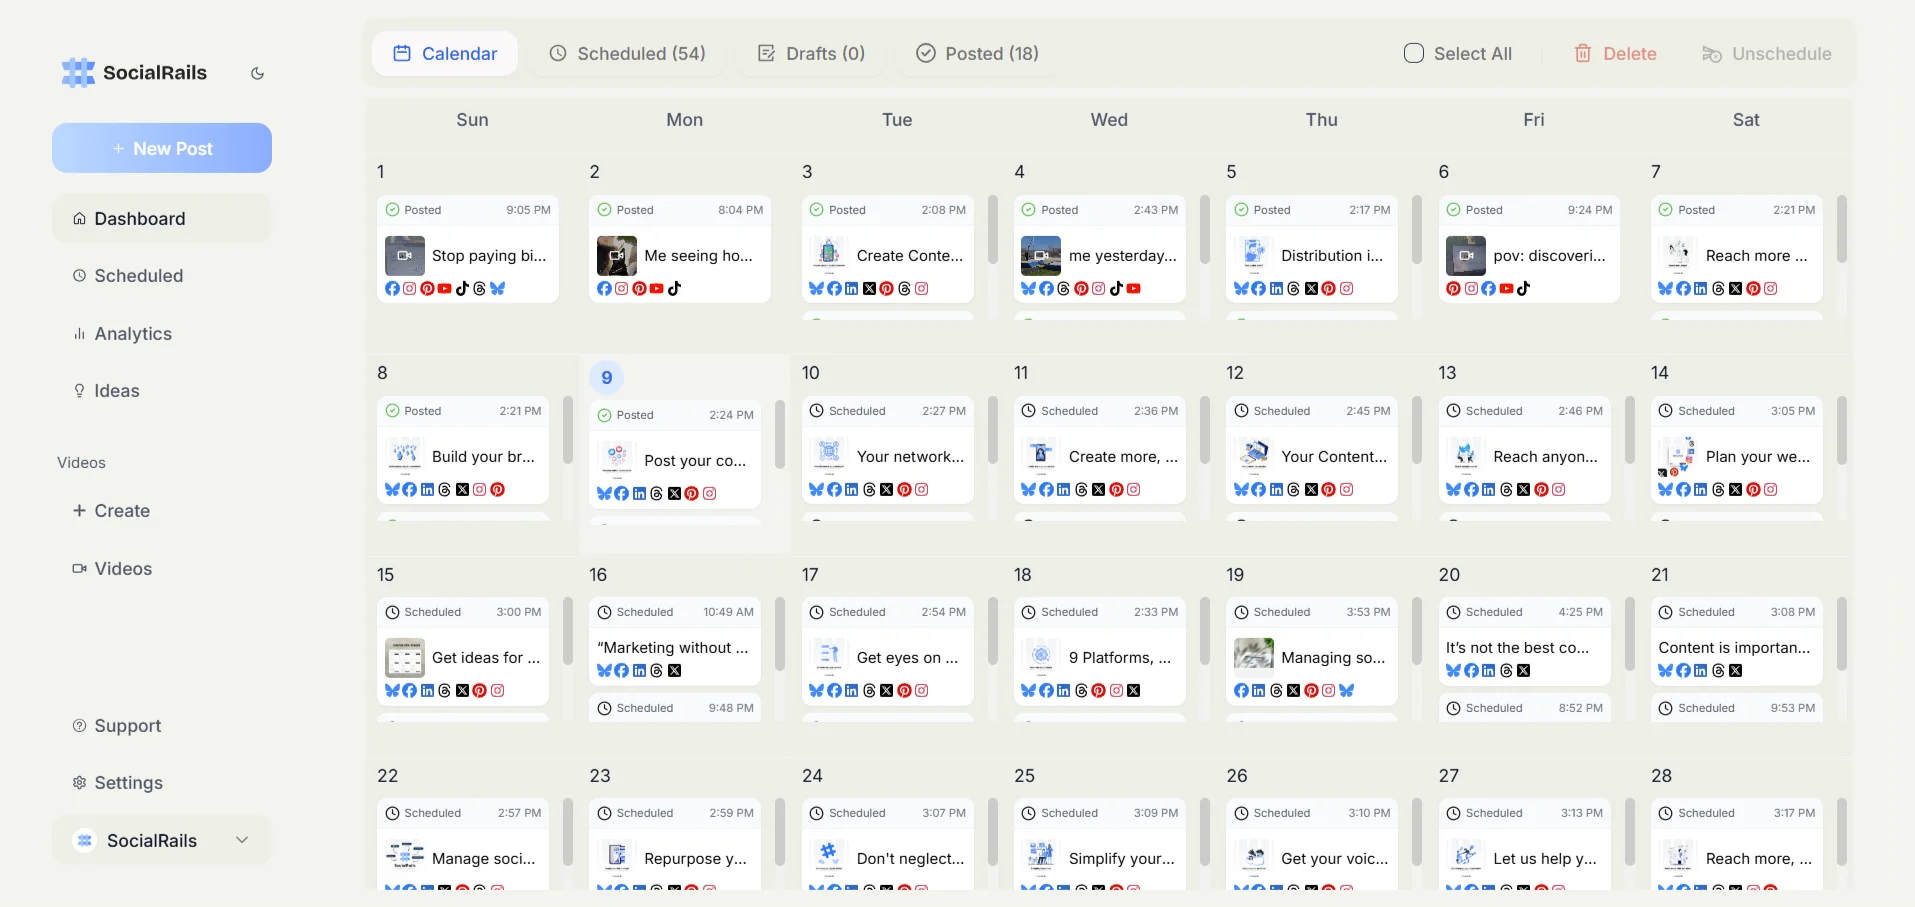
The social media landscape has evolved into a complex ecosystem of platforms, each offering unique features, audiences, and business opportunities. DataReportal put social media at 5.79 billion user identities in April 2026, about 69.9% of the world's population, with the average user spending roughly 2 hours 21 minutes a day across platforms.
On concentrating your effort: the advice to pick a few platforms and do them properly is sound, and it is what the rest of this page is built around. Earlier versions of this page attached numbers to it, claiming businesses on 3-5 platforms see "67% better engagement rates" and "43% higher ROI". Those figures were not sourced to anything and have been removed. No study we could find measures that, and the honest version needs no statistic: your effort per platform is finite, and a channel you post to twice a month performs like a channel you do not have.
Understanding Platform Evolution and Positioning
Social media platforms continuously evolve their features, algorithms, and business models. Understanding each platform's core strengths and strategic positioning helps businesses make informed decisions about where to invest their time and resources.
Platform Evolution Trends:
- Video-first transformation - Most platforms prioritizing video content over static posts
- E-commerce integration - Direct shopping capabilities becoming standard across platforms
- AI-powered algorithms - Sophisticated content recommendation systems driving engagement
- Creator economy focus - Enhanced tools and monetization options for content creators
- Privacy-first approach - Increased emphasis on user privacy and data protection
Strategic Positioning Factors:
- Primary use case - Entertainment, professional networking, news, or shopping
- Content format preference - Video, images, text, or mixed media optimization
- Audience demographics - Age, income, education, and lifestyle characteristics
- Business model - Advertising revenue, subscription, or e-commerce focused
- Algorithm behavior - How content discovery and distribution work
The Business Impact of Strategic Platform Selection
Companies that strategically select and optimize their social media platforms report significant improvements in marketing effectiveness and business outcomes.
What concentrating actually buys you:
- Higher engagement quality, because you are posting to platforms you understand
- Better conversion rates, because the content fits the platform rather than being cross-posted
- Lower production cost, since one format done well beats five done badly
- Stronger brand recognition, from showing up consistently in one place rather than sporadically in ten
- More durable customer relationships, because you can actually reply to people
These used to be a list of percentages, and all five were invented. The page claimed an 89% engagement improvement, 156% better conversion, 78% cost reduction, 67% brand recognition lift and 43% higher customer lifetime value, sourced to nobody. The giveaway was that the same 67% and 43% also appeared two sections earlier attached to entirely different claims, which is not how real research behaves. The direction of every one of these is right and worth stating; the numbers were decoration.
2026 Platform Landscape: What's New
Emerging Platforms You Can't Ignore
Threads (Meta's Twitter Alternative)
- Launch: July 2023, now 350M+ monthly active users (Jan 2026)
- Best for: Text-based content, real-time conversations, Instagram crossover audience
- Key advantage: Instant audience from Instagram following
- Limitation: Still developing advertising features
- Use case: Brands already on Instagram looking for text-based engagement
Formatting for Threads: Enhance your Threads posts with the Threads Text Formatter. Add bold and italic text to make your 500-character posts more readable and professional, helping key messages stand out in the Instagram-connected feed.
BlueSky
- Status: Decentralized Twitter alternative gaining momentum
- Users: 15M+ monthly active users (growing rapidly)
- Best for: Early adopters, tech-savvy audiences, Twitter refugees
- Key advantage: Chronological feed, no algorithm manipulation
- Limitation: Smaller audience, invite-only periods
Content Formatting Tip: Stand out on Bluesky with formatted text using the Bluesky Text Formatter. Add bold and italic text to your 300-character posts to emphasize key points and make your content more engaging on this growing decentralized platform.
Lemon8 (ByteDance)
- Launch: TikTok's lifestyle-focused platform
- Users: 20M+ monthly active users (Asia + US expansion)
- Best for: Lifestyle brands, visual content, younger demographics
- Key advantage: Early mover advantage, low competition
- Limitation: Still building US presence
Platform Size, April 2026
Read the methodology column before comparing these numbers. Platform reach is measured two incompatible ways and mixing them is how comparison articles end up nonsense. Ad reach is what a platform's own ad tools say you can reach, which is what matters if you are buying ads. Self-reported MAU is what the company announces, is not audited, and uses each company's own definition of "active".
The headline change: YouTube has overtaken Facebook on ad reach, which DataReportal called the biggest reshuffle at the top in a decade. If your last platform plan assumed Facebook was automatically the largest channel, that assumption is now out of date.
Two cautions on this table:
- LinkedIn's 1.3 billion is members, not active users, and LinkedIn has never published a comparable MAU figure. It is not the same kind of number as the rows above it and should not be ranked against them
- X's user count is genuinely disputed. Musk has self-reported around 600 million monthly active users; independent analytics firms put it closer to 540-570 million. We publish the range because the sources do not agree, and there is no audited figure to prefer
Why this section was rebuilt: it previously ran under the heading "Updated 2026 Platform Statistics" with a column headed "2026 Users", and its own source line read "Meta, Alphabet, LinkedIn Q4 2024 Reports". The source line was correct and the heading was not. A separate set of even older figures sat in the platform-by-platform section below, so the page carried two contradictory answers to its central question.
On advertising costs: the old table gave average CPC to the cent for every platform, unsourced. Those numbers move constantly and vary by an order of magnitude between industries, countries and campaign objectives, so a single figure per platform is misleading however it is sourced. The advertising section below covers relative cost, which is the part that stays true.
Detailed Platform Analysis and Comparison
Facebook: The Community Builder
Facebook is no longer the largest platform by ad reach, having been passed by YouTube in 2026, but it remains enormous and has the deepest business tooling and ad targeting of any network. See the table above for current reach figures rather than relying on a number quoted in prose.
Facebook Strengths:
- Massive reach - Largest user base across diverse demographics
- Advanced targeting - Sophisticated advertising platform with detailed audience options
- Community features - Groups, events, and pages for community building
- E-commerce integration - Facebook Shops and Marketplace functionality
- Cross-platform synergy - Integration with Instagram and WhatsApp
Facebook Limitations:
- Declining organic reach - Algorithm changes reducing unpaid content visibility
- Aging user base - Younger demographics migrating to other platforms
- Privacy concerns - Ongoing scrutiny affecting user trust and engagement
- Content saturation - High competition for audience attention
- Complex advertising - Steep learning curve for effective campaign management
Best For: Community building, detailed targeting, e-commerce, B2C businesses with broad demographics
Instagram: The Visual Storyteller
Instagram's visual-first approach reaches around 2 billion people by ad reach, and Meta reports a higher figure for monthly actives. It remains essential for brands with strong visual content.
Instagram Strengths:
- Visual engagement - High engagement rates for quality visual content
- Shopping integration - Seamless e-commerce experience within the app
- Story features - Ephemeral content for real-time engagement
- Reels growth - Short-form video content with high organic reach
- Influencer ecosystem - Large creator community for partnership opportunities
Instagram Limitations:
- Algorithm challenges - Frequent changes affecting content visibility
- Content quality demands - High expectations for visual content quality
- Limited link sharing - Restricted ability to drive traffic from posts
- Competition intensity - Highly saturated with brand content
- Resource intensive - Requires significant time for content creation and community management
Best For: Visual brands, e-commerce, lifestyle businesses, influencer marketing, younger demographics
When comparing Instagram to Snapchat for your business, consider audience demographics and platform features - our complete Instagram vs Snapchat comparison analyzes which platform works better for different business types and goals.
LinkedIn: The Professional Network
LinkedIn has passed 1.3 billion registered members worldwide, offering unique opportunities for B2B marketing and professional brand building. Note that members is a cumulative signup count, not an active-user figure, so treat it as a ceiling rather than an audience.
LinkedIn Strengths:
- Professional audience - High-value demographics with business decision-making power
- B2B effectiveness - Excellent for lead generation and professional networking
- Thought leadership - Platform rewards educational and insightful content
- Targeted advertising - Precise professional and company-based targeting options
- Content longevity - Posts have longer lifespan compared to other platforms
LinkedIn Limitations:
- Limited B2C appeal - Less effective for consumer-focused businesses
- Higher advertising costs - Premium pricing for professional audience access
- Formal tone requirements - Less flexibility for creative or casual content
- Smaller user base - Limited reach compared to mainstream social platforms
- Algorithm conservatism - Slower adoption of new content formats
Best For: B2B businesses, professional services, thought leadership, recruitment, high-value sales
Twitter: The Real-Time Conversation Hub
X hosts real-time conversation, news sharing and trend participation. Its active user count is disputed, with self-reported and third-party estimates ranging from roughly 540 to 600 million, so treat any single figure with caution.
Twitter Strengths:
- Real-time engagement - Immediate conversation and trend participation
- News and updates - Effective platform for announcements and customer service
- Viral potential - Content can spread rapidly through retweets and engagement
- Hashtag discovery - Strong hashtag culture for content discoverability
- Diverse demographics - Broad age range and professional representation
Twitter Limitations:
- Character constraints - Limited space for detailed messaging
- Fast-moving timeline - Content quickly becomes buried in feeds
- Toxicity concerns - Platform struggles with harassment and negative interactions
- Algorithm changes - Shift from chronological to algorithmic timeline
- Engagement decline - Lower engagement rates compared to visual platforms
Best For: News organizations, customer service, real-time updates, thought leadership, trending topics
TikTok: The Entertainment Powerhouse
TikTok reports around 1.59 billion monthly active users outside China, and its ad reach passed 2 billion adults in 2026, the fastest growth of any major network. Short-form video, with engagement rates well above the older networks.
TikTok Strengths:
- Massive engagement - Highest engagement rates across all social platforms
- Algorithm effectiveness - Excellent content discovery for new accounts
- Creative format - Short-form video content with high viral potential
- Young demographics - Strong presence among Gen Z and millennial audiences
- Authentic content - Rewards genuine, unpolished content over professional production
TikTok Limitations:
- Demographic concentration - Primarily younger audience with limited purchasing power
- Content demands - Requires video creation skills and trending awareness
- Platform uncertainty - Regulatory concerns affecting long-term viability
- Limited business tools - Fewer analytics and advertising options compared to established platforms
- Fast trend cycles - Content becomes outdated quickly
Best For: Entertainment brands, consumer products, young demographics, creative industries, viral marketing
YouTube: The Video Education Hub
YouTube's 2.65 billion ad reach now makes it the largest platform on that measure, as well as the second-largest search engine and the premier video platform.
YouTube Strengths:
- Search engine power - Videos appear in Google search results
- Long-form content - Supports educational and detailed content formats
- Monetization options - Multiple revenue streams for creators and businesses
- SEO benefits - Video content improves overall search engine optimization
- Global reach - Massive international audience across all demographics
YouTube Limitations:
- Production requirements - Higher content quality expectations
- Competition intensity - Millions of creators competing for attention
- Algorithm complexity - Difficult to understand and optimize for discovery
- Time investment - Requires significant time for content creation and editing
- Comment management - Requires active moderation and community management
Best For: Educational content, tutorials, product demonstrations, long-form storytelling, global reach
Comprehensive Social Media Platform Comparison
What each platform is actually for. Reach figures live in the size table above and deliberately not here, because this page previously carried both and they disagreed with each other.
Engagement rate was also dropped from this table. The figures it carried (TikTok 5.96%, Facebook 0.07%) came from third-party benchmark reports that each define engagement differently and measure different account sizes, so ranking platforms by them compares four incompatible metrics. TikTok does reliably out-engage the older networks, which is the part worth acting on; the decimal place is not.
On relative ad cost: LinkedIn is genuinely several times more expensive per click than the others, which is the durable fact. Absolute figures move constantly and vary by industry, country and objective, so check your own ad manager rather than any published average, including ours.
Audience Demographics Across Platforms
Age Distribution Analysis
Understanding age demographics across platforms helps businesses target their ideal customers effectively.
Platform age skew, stated as direction rather than invented precision:
- TikTok skews youngest, concentrated in the under-35 brackets. For actual figures see our TikTok age demographics guide
- Facebook skews oldest of the major networks and is now weakest with under-25s
- LinkedIn clusters in working age, roughly 25-54, by construction
- X (Twitter) skews 25-49 and male
- YouTube is the most evenly distributed across age groups of any platform here
The percentages that used to be here were removed rather than updated. They reported TikTok as "41% aged 16-24", and 16-24 is not a bracket any platform publishes. Ad tools report 18-24 and 25-34, because under-18 data is handled separately. A figure using a bracket no source publishes cannot have been taken from a source, which is the same tell row 315 found on our TikTok demographics page. Pull current numbers from each platform's own ad tool, where you can also filter to your country, which is what actually determines whether a platform fits you.
Income and Education Demographics
Different platforms attract users with varying income levels and educational backgrounds.
Income and education skew, again as direction:
- LinkedIn has the highest-income and highest-education base by a wide margin, which is most of why its ad costs are several times everyone else's
- Facebook is the closest to a general population sample in most countries
- X (Twitter) skews more educated and more urban than average
- Instagram skews affluent in developed markets
Specific income percentages were removed. They were unsourced, and household income data of that kind comes from national survey panels that differ by country, so a single global percentage is not a meaningful number even when someone has one.
Geographic Distribution:
- Global platforms - Facebook, Instagram, YouTube, TikTok
- Regional strength - LinkedIn strong in North America and Europe
- Emerging markets - TikTok and Instagram growing rapidly in Asia and Latin America
Behavioral Patterns and Usage
Understanding how users behave on each platform informs content strategy and engagement approaches.
Usage Patterns:
- Facebook - Longer sessions, community interaction, news consumption
- Instagram - Quick browsing, story viewing, shopping discovery
- LinkedIn - Professional research, networking, industry news
- Twitter - Real-time news, quick interactions, trend following
- TikTok - Entertainment consumption, trend participation, discovery
- YouTube - Educational viewing, entertainment, research
Ready to build your strategy? Master social media marketing for small business →
Content Format Requirements and Opportunities
Visual Content Specifications
Each platform has specific requirements and best practices for visual content optimization.
Image Specifications:
- Facebook - 1200x630px for posts, 1080x1080px for profile
- Instagram - 1080x1080px for posts, 1080x1920px for Stories
- LinkedIn - 1200x627px for posts, 1584x396px for covers
- Twitter - 1200x675px for posts, 1500x500px for headers
- TikTok - 1080x1920px vertical video format
- YouTube - 1280x720px minimum, 1920x1080px recommended
Video Content Requirements:
- Facebook - 1:1 or 16:9 ratio, up to 240 minutes
- Instagram - 1:1 for feed, 9:16 for Stories/Reels, up to 60 seconds for Reels
- LinkedIn - 16:9 or 1:1 ratio, up to 10 minutes
- Twitter - 16:9 ratio, up to 2 minutes 20 seconds
- TikTok - 9:16 ratio, 15 seconds to 3 minutes
- YouTube - 16:9 ratio, no length limit
Platform-Specific Content Strategies
Facebook Content Strategy:
- Community-focused content - Posts that encourage discussion and sharing
- Live video - Real-time engagement with followers
- User-generated content - Customer stories and testimonials
- Educational content - How-to guides and industry insights
- Behind-the-scenes - Company culture and process transparency
Instagram Content Approach:
- High-quality visuals - Professional photography and graphic design
- Story highlights - Organized content categories for easy discovery
- Reel trends - Participation in trending audio and challenges
- Shopping posts - Product features with direct purchase options
- Influencer collaborations - Partnership content and takeovers
LinkedIn Content Focus:
- Thought leadership - Industry insights and professional expertise
- Company updates - Business news, achievements, and milestones
- Educational content - Professional development and skill building
- Employee advocacy - Team member spotlights and achievements
- Industry analysis - Market trends and business strategy content
Advertising Options and Cost Comparison
Platform Advertising Capabilities
Facebook Advertising:
- Targeting precision - Detailed demographic, interest, and behavioral targeting
- Ad formats - Image, video, carousel, collection, and dynamic ads
- Campaign objectives - Brand awareness, traffic, engagement, conversions, catalog sales
- Budget flexibility - Daily or lifetime budgets starting from $1
- Performance tracking - Comprehensive analytics and attribution reporting
Instagram Advertising:
- Visual-first formats - Photo, video, carousel, and story ads
- Shopping integration - Product catalog ads and shopping tags
- Influencer partnerships - Branded content and creator collaborations
- Story advertising - Full-screen immersive ad experiences
- Reels advertising - Short-form video ad placements
LinkedIn Advertising:
- Professional targeting - Job title, company, industry, and skill-based targeting
- B2B focus - Lead generation forms and account-based marketing
- Content promotion - Sponsored content and thought leadership amplification
- Premium audience - Access to decision-makers and high-income professionals
- Conversion tracking - Detailed ROI measurement for B2B campaigns
Social Media Advertising Cost and ROI Analysis Comprehensive comparison of advertising investment and return potential
This table used to carry exact CPC, CPM and conversion rates, and they were a third set of numbers that disagreed with the two tables above them on this same page (Instagram at $1.20 here against $1.23 there, LinkedIn $5.26 against $5.58). When one page gives three different answers, none of them is a source.
They also failed a sanity check: a 9.21% conversion rate was listed for Facebook ads, which is far above what any broad benchmark reports and would be a remarkable result for a specific well-optimised funnel, let alone a platform average.
Ad costs are the wrong thing to take from an article. They move continuously and vary by industry, country, audience and objective more than they vary by platform. The durable facts are the relative ordering above, especially that LinkedIn is in a different price bracket, and everything else belongs in your own ad manager.
Measure what you are actually getting with our engagement calculator and ad revenue calculator, then optimise spend against your own numbers rather than published averages.
Strategic Platform Selection Framework
Business Goals Alignment
Brand Awareness Objectives:
- Best platforms - TikTok, Instagram, YouTube for visual brands
- Content strategy - Entertaining, shareable content with broad appeal
- Metrics focus - Reach, impressions, brand mention tracking
- Budget allocation - 60% content creation, 40% paid promotion
Lead Generation Goals:
- Best platforms - LinkedIn, Facebook for targeted audience acquisition
- Content strategy - Educational content with clear value propositions
- Metrics focus - Lead quality, cost per lead, conversion rates
- Budget allocation - 40% content creation, 60% paid advertising
Sales and Conversion Objectives:
- Best platforms - Instagram, Facebook with shopping integration
- Content strategy - Product-focused content with clear CTAs
- Metrics focus - Conversion rate, ROAS, customer acquisition cost
- Budget allocation - 30% content creation, 70% performance advertising
Industry-Specific Recommendations
B2B Technology Companies:
- Primary platform - LinkedIn for thought leadership and lead generation
- Secondary platforms - YouTube for educational content, Twitter for industry news
- Content mix - 50% educational, 30% company updates, 20% industry insights
- Success metrics - Lead quality, sales pipeline contribution, brand authority
E-commerce Retail:
- Primary platform - Instagram for visual product showcase
- Secondary platforms - Facebook for community building, TikTok for viral reach
- Content mix - 40% product features, 30% user-generated content, 30% lifestyle
- Success metrics - Conversion rate, ROAS, customer lifetime value
Professional Services:
- Primary platform - LinkedIn for professional networking
- Secondary platforms - Facebook for local community, YouTube for expertise demonstration
- Content mix - 60% educational, 25% client success stories, 15% company culture
- Success metrics - Lead generation, brand recognition, client acquisition
To effectively manage multiple platforms without spreading your resources too thin, authentic social media management platforms like SocialRails help you coordinate cross-platform strategies while maintaining each platform's unique voice and requirements, ensuring consistent presence without resorting to generic automation that fails to leverage each platform's strengths.
Implementation and Resource Allocation
Platform Launch Strategy
Phase 1: Foundation (Months 1-2):
- Platform setup - Complete profile optimization and branding
- Content planning - Develop platform-specific content calendars
- Team training - Educate team on platform best practices
- Tool integration - Set up management and analytics tools
- Initial content - Launch with 2-3 weeks of pre-planned content
Phase 2: Growth (Months 3-6):
- Content optimization - A/B test different content types and formats
- Community building - Engage actively with followers and industry conversations
- Paid promotion - Begin strategic advertising campaigns
- Partnership development - Identify and engage potential collaboration partners
- Performance analysis - Regular review and strategy adjustments
Phase 3: Scale (Months 6+):
- Advanced features - Utilize platform-specific advanced tools and features
- Automation implementation - Streamline workflows with scheduling and automation
- Cross-platform integration - Coordinate campaigns across multiple platforms
- ROI optimization - Focus resources on highest-performing platforms and content
- Strategic expansion - Consider additional platforms based on success metrics
Resource Planning and Budget Allocation
Team Structure Requirements:
- Content creator - 40% of resources for content development
- Community manager - 30% of resources for engagement and customer service
- Analyst - 20% of resources for performance tracking and optimization
- Strategic oversight - 10% of resources for planning and coordination
Budget Distribution Framework:
- Content creation - 35% for graphics, video, and written content
- Paid advertising - 45% for promotional campaigns and audience growth
- Tools and software - 15% for management platforms and analytics tools
- Training and development - 5% for team education and skill building
Take your management to the next level Discover proven social media best practices →
Success Metrics and Optimization
Platform-Specific KPIs
Facebook Success Metrics:
- Engagement rate - Comments, shares, and reactions per post
- Page growth - New followers and page likes
- Community activity - Group engagement and discussion participation
- Website traffic - Referral traffic from Facebook content
- Lead generation - Contact form submissions and email sign-ups
Instagram Performance Indicators:
- Visual engagement - Likes, comments, and saves on posts
- Story completion - Percentage of users viewing full stories
- Shopping interactions - Product views and purchase conversions
- Hashtag reach - Discovery through hashtag searches
- Profile visits - Traffic to business profile and website links
LinkedIn Business Metrics:
- Professional engagement - Comments, shares, and connection requests
- Content reach - Impressions among target professional demographics
- Lead quality - Professional inquiries and business development opportunities
- Thought leadership - Article views and industry recognition
- Network growth - Quality connections within target industries
Cross-Platform Analytics and Reporting
Unified Reporting Framework:
- Consolidated dashboard - All platform metrics in single view
- Goal alignment - Metrics tied to specific business objectives
- ROI calculation - Revenue attribution across all platforms
- Competitive benchmarking - Performance comparison with industry standards
- Trend identification - Pattern recognition across platforms and time periods
Optimization Strategies:
- Content performance analysis - Identify top-performing content types
- Audience engagement patterns - Optimal posting times and frequency
- Resource reallocation - Shift budget to highest-performing platforms
- Creative testing - A/B test different content approaches
- Platform feature adoption - Utilize new features for competitive advantage
Key Takeaways for Platform Selection Success
Choosing the right social media platforms requires strategic thinking, audience understanding, and continuous optimization. Here are the essential takeaways to implement immediately:
Strategic Foundation
Platform Selection Criteria:
- Audience alignment - Choose platforms where your target audience is most active
- Content strength - Select platforms that showcase your content type effectively
- Resource capacity - Focus on platforms you can manage consistently and professionally
- Business goals - Align platform selection with specific business objectives
Quality Over Quantity:
- 3-5 platform focus - Better to excel on fewer platforms than struggle on many
- Deep platform knowledge - Understand each platform's unique characteristics and best practices
- Consistent execution - Maintain regular, high-quality presence on chosen platforms
- Resource optimization - Allocate sufficient time and budget for success
Implementation Excellence
Platform Optimization:
- Profile completion - Fully optimize all business profiles with consistent branding
- Content adaptation - Customize content for each platform's format and audience
- Community engagement - Actively participate in conversations and respond to interactions
- Feature utilization - Take advantage of platform-specific business tools and features
Performance Tracking:
- Platform-specific metrics - Track relevant KPIs for each platform
- Cross-platform analysis - Understand how platforms work together
- ROI measurement - Calculate return on investment for each platform
- Continuous optimization - Regular strategy adjustments based on performance data
Growth and Scaling
Strategic Expansion:
- Performance-based growth - Add new platforms only after mastering current ones
- Resource planning - Ensure adequate resources before platform expansion
- Audience research - Validate audience presence before entering new platforms
- Competitive analysis - Monitor competitor success on different platforms
Long-term Success:
- Platform evolution - Stay updated on platform changes and new features
- Audience migration - Monitor and adapt to changing user demographics
- Technology integration - Leverage tools and automation for efficiency
- Strategic flexibility - Remain adaptable to platform and market changes
Success Benchmarks:
- Engagement quality - Meaningful interactions rather than vanity metrics
- Business impact - Measurable contribution to business goals
- Audience growth - Sustainable increase in relevant followers
- Platform expertise - Deep understanding of chosen platforms' capabilities
Frequently Asked Questions
Which social media platform should I choose for my business?
Choose platforms based on your target audience demographics and business goals. Facebook and Instagram work well for most businesses, LinkedIn is essential for B2B companies, TikTok and YouTube are great for reaching younger audiences, and Twitter works for real-time engagement and news sharing.
How many social media platforms should a business use?
Most businesses should focus on 3-5 platforms initially. It's better to excel on fewer platforms than struggle to maintain presence on many. Start with 2-3 platforms where your audience is most active, then expand as you build capacity and expertise.
What's the difference between Facebook and Instagram for business?
Facebook targets older demographics (25-65) and works well for community building, customer service, and local businesses. Instagram focuses on visual content for younger audiences (18-45) and excels at product showcasing, brand storytelling, and e-commerce integration.
Is TikTok worth it for business marketing?
TikTok is valuable for businesses targeting audiences under 35, especially in entertainment, fashion, food, and lifestyle sectors. It requires authentic, creative content and significant time investment but offers high viral potential and engagement rates for the right businesses.
Which platform has the best ROI for business marketing?
ROI varies by business type and strategy. Facebook typically offers strong ROI for local businesses and e-commerce, LinkedIn excels for B2B lead generation, Instagram works well for product sales, and YouTube provides long-term value for educational and service-based businesses.
How do platform demographics affect my content strategy?
Platform demographics should guide your content tone, format, and timing. Younger audiences on TikTok and Instagram prefer casual, visual content, while LinkedIn audiences expect professional, informative content. Facebook audiences appreciate community-focused, family-friendly content.
Can I use the same content across all social media platforms?
While you can repurpose content, each platform requires adaptation. Instagram needs high-quality visuals, LinkedIn requires professional context, TikTok needs trending formats, and Twitter needs concise messaging. Tailor your content to each platform's unique characteristics and audience expectations.
What are the costs associated with different social media platforms?
Organic posting is free on all platforms, but advertising costs vary. Facebook and Instagram ads start around $1/day, LinkedIn ads are more expensive at $2-3+ per click, YouTube ads cost $0.10-0.30 per view, and TikTok ads start around $20/day. Factor in content creation and management time costs.
How do algorithm changes affect platform selection?
Algorithms affect organic reach and engagement across all platforms. Diversify your platform presence to reduce risk, focus on engagement quality over quantity, build email lists as owned media backup, and stay informed about algorithm updates to adapt your strategy accordingly.
Ready to make strategic decisions about your social media platform selection? Start with SocialRails → - Get comprehensive platform management tools with analytics, content planning, and performance tracking across all major platforms. Transform your social media strategy today!
Was this article helpful?
Let us know what you think!